Actionable Insights Clearly Delivered,
Driving Your Streaming Success
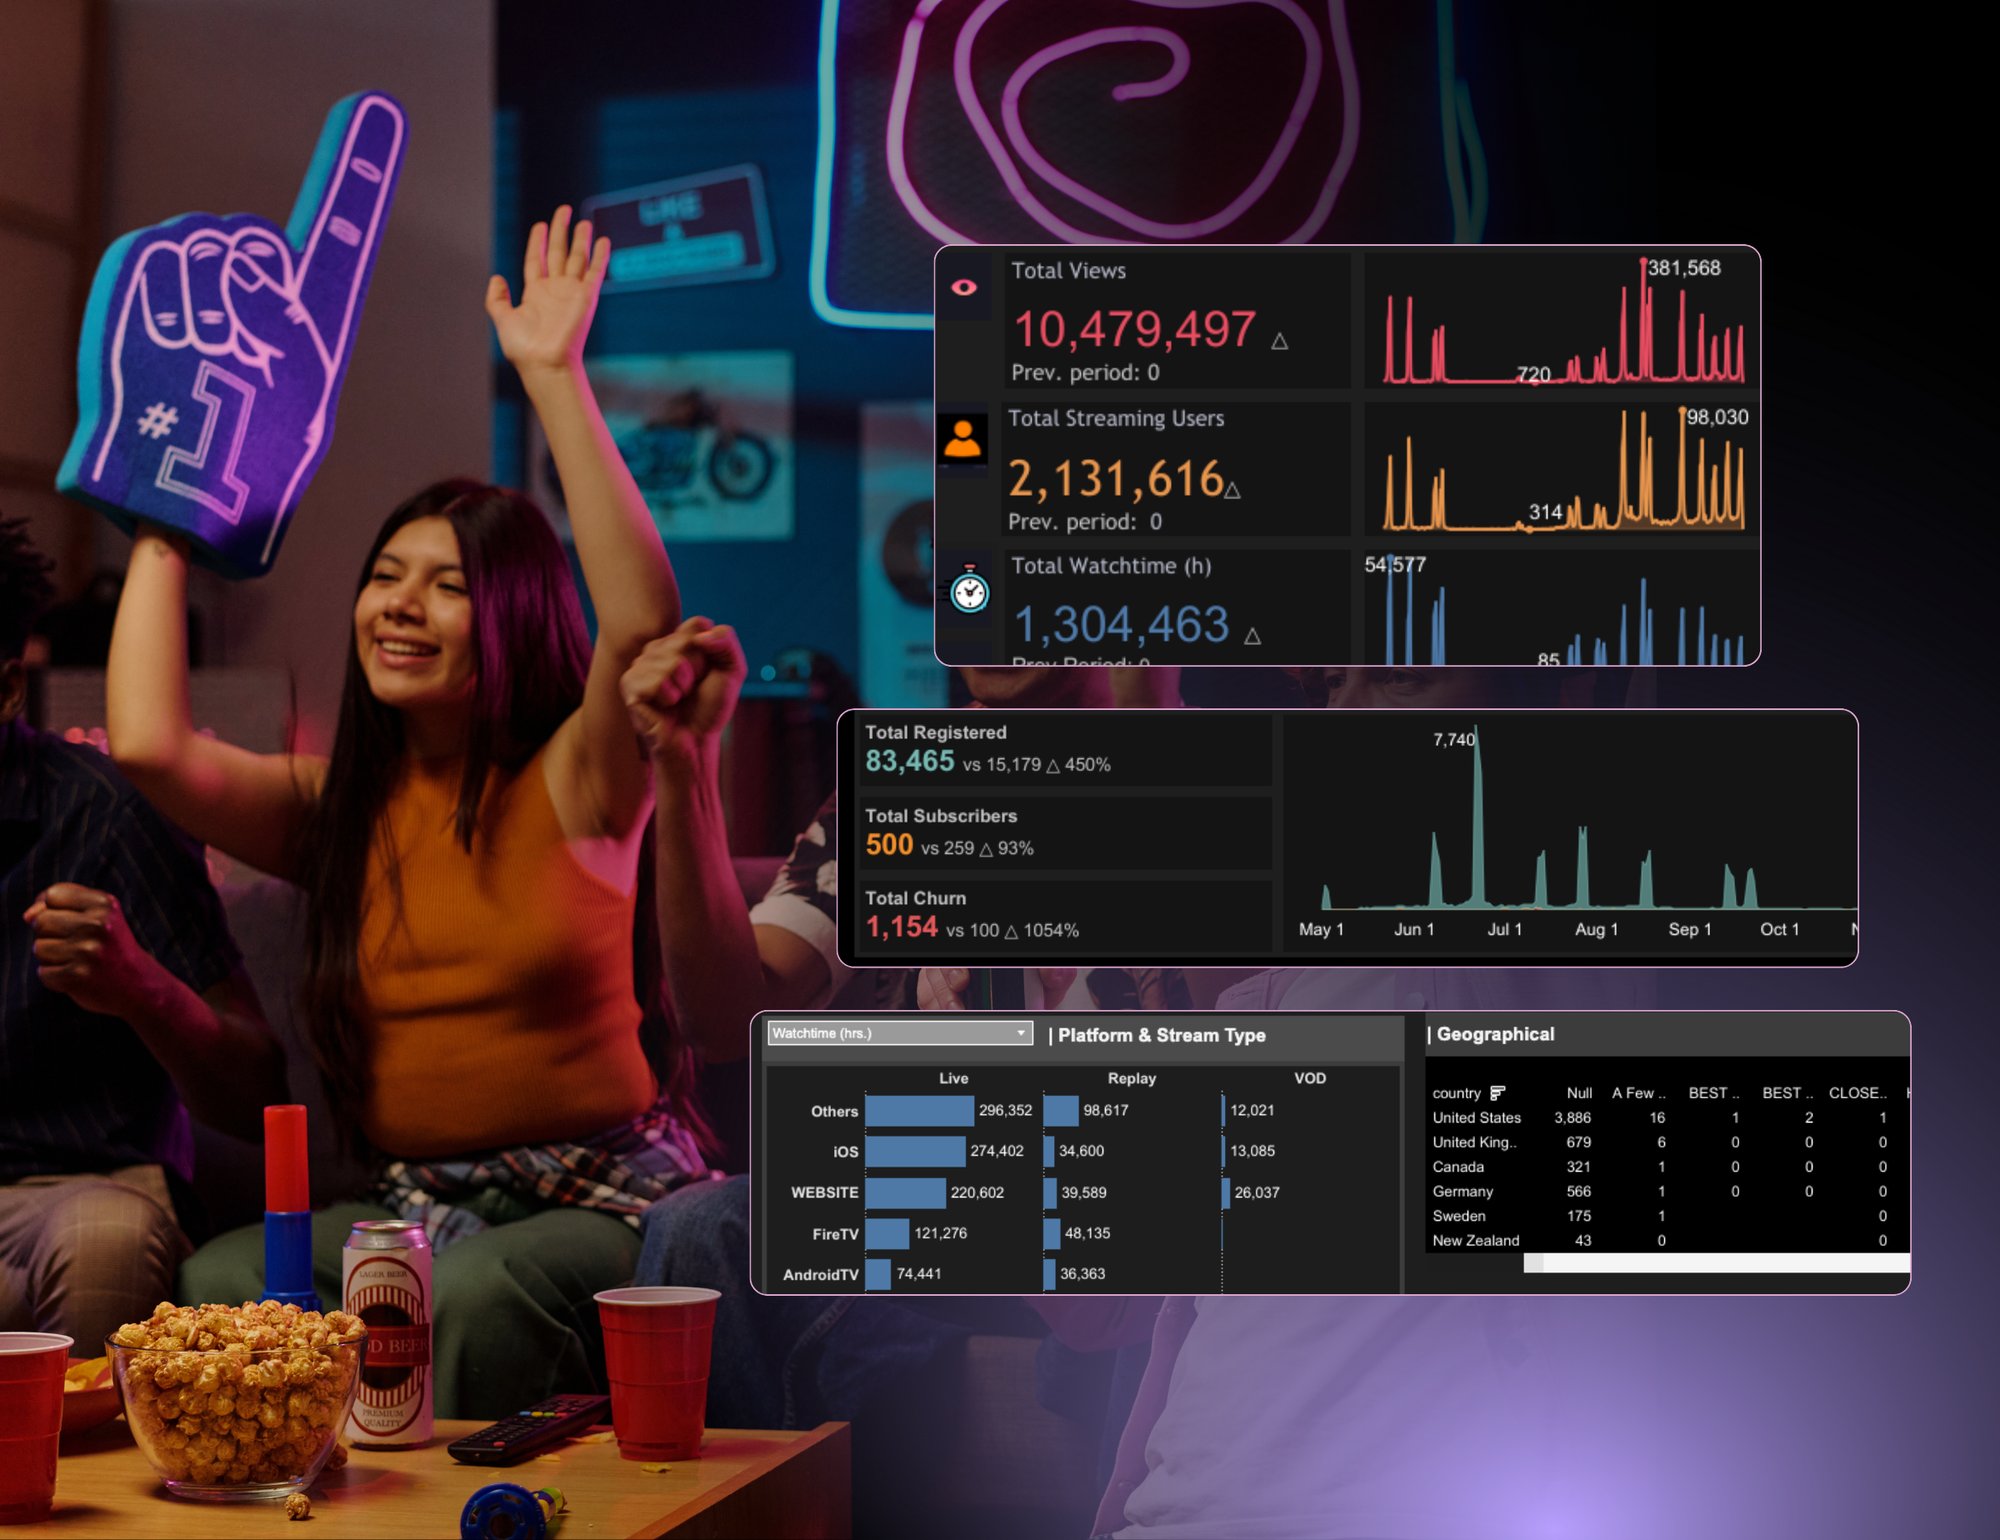
Watch Your Streaming
Performance from Every Angle
Performance from Every Angle
Insights That Bring
New Users Onboard
New Users Onboard

Keep Elevating Your
Streaming Quality
Streaming Quality

Right Content, Right
Place, Right Time
Place, Right Time